We recently released a new network poller for Sonar. Here’s some background on how it works!
Network monitoring is a necessary part of running any ISP. Just as we have to monitor our infrastructure to keep Sonar running smoothly, an ISP has to monitor their network to catch issues before they happen, or respond to outages.
There are a myriad network monitoring solutions on the market, from open source platforms like Zabbix, to commercial offerings like SolarWinds, and many, many more in between.
Sonar has a network monitoring solution integrated directly into the application, and our goal with this platform is the same as most of our other offerings — bring all the data into a single view for an ISPs staff, and draw on all the other information we have available to us to make their life easier.
Letting support staff view statistics on devices from the same platform they’re doing all their other work saves time, shortens calls, and improves customer satisfaction, but we’re here to talk about the technical parts. How does it work?
The Poller
The Sonar Poller is an open source application, built on top of other open source applications. It’s split into three major components — work fetching and formatting, co-routine based work pools, and device mappers.
The majority of network monitoring performed today relies on two protocols — SNMP and ICMP — to collect data about network performance. While there are other options out there like TR-069 and IPFIX, SNMP and ICMP have been the default options for a very, very long time.
ICMP
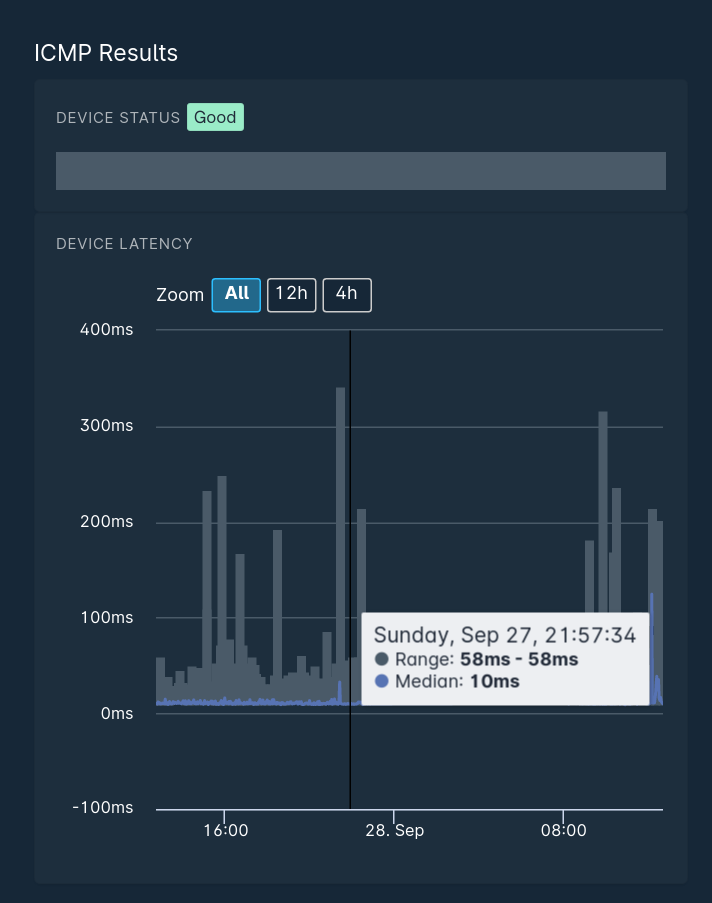
ICMP allows us to collect data about packet loss and latency of devices. While there are a variety of data points that can be collected using ICMP, measuring latency and calculating packet loss tend to be the main ones. The Sonar poller uses ICMP (specifically fping) to collect these metrics. This allows us to track the history of a device’s performance.
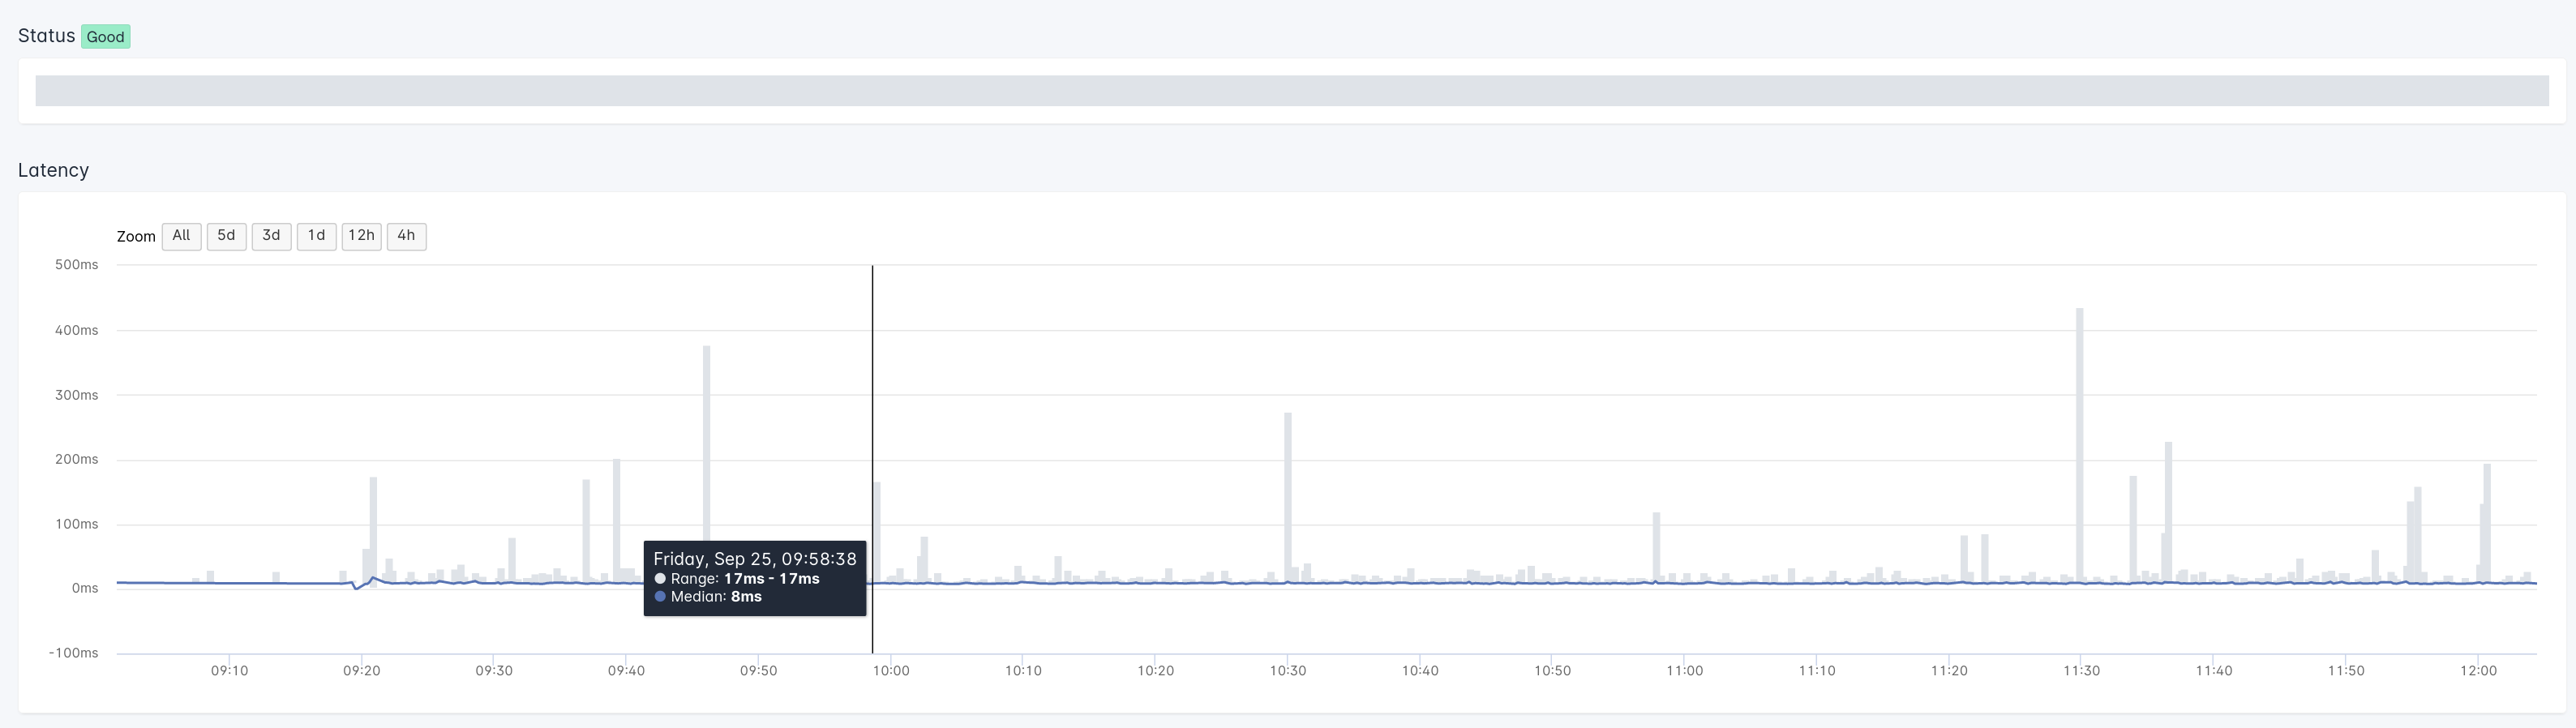
The other metric we can calculate by collecting this data is jitter. Jitter is the difference in delay between packets, and variable jitter can cause issues with real time communications — voice being the most noticeable one, but it can also be very impactful to online gamers, or other people engaging in real time applications that are heavily reliant on a consistent flow of data.
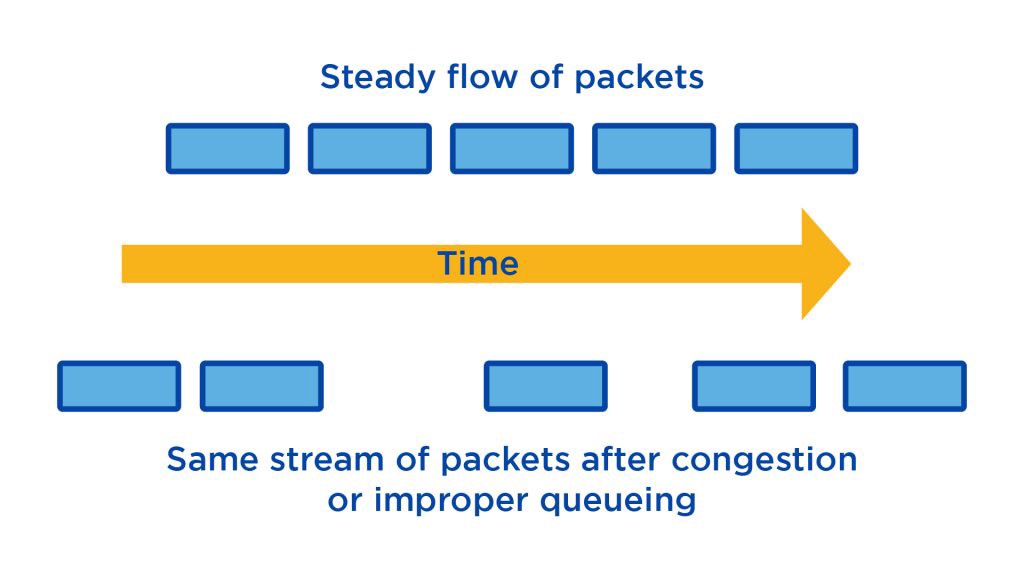
In the Sonar graph shown above, the grey portions show the jitter over time, whereas the colored line shows the median latency. As you can see, by only looking at the colored line, the connection looks very stable, but by including the range of response times, we can see there is significant variation at some points.
SNMP
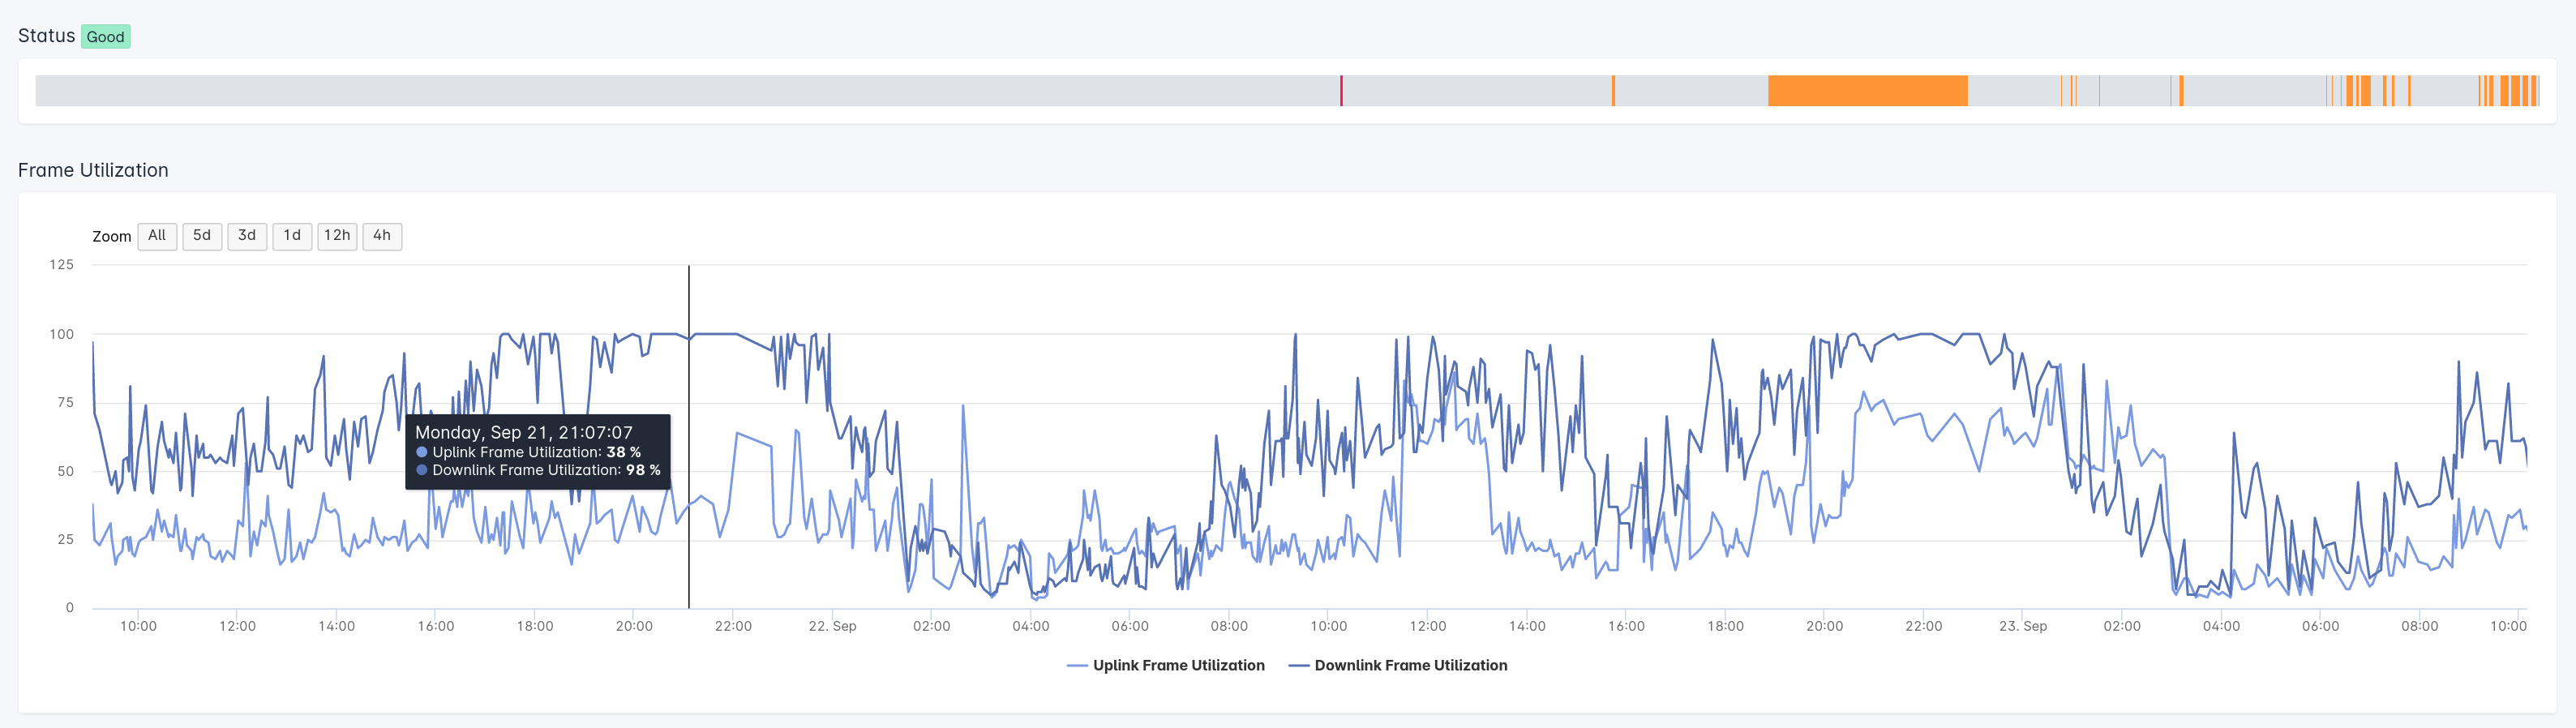
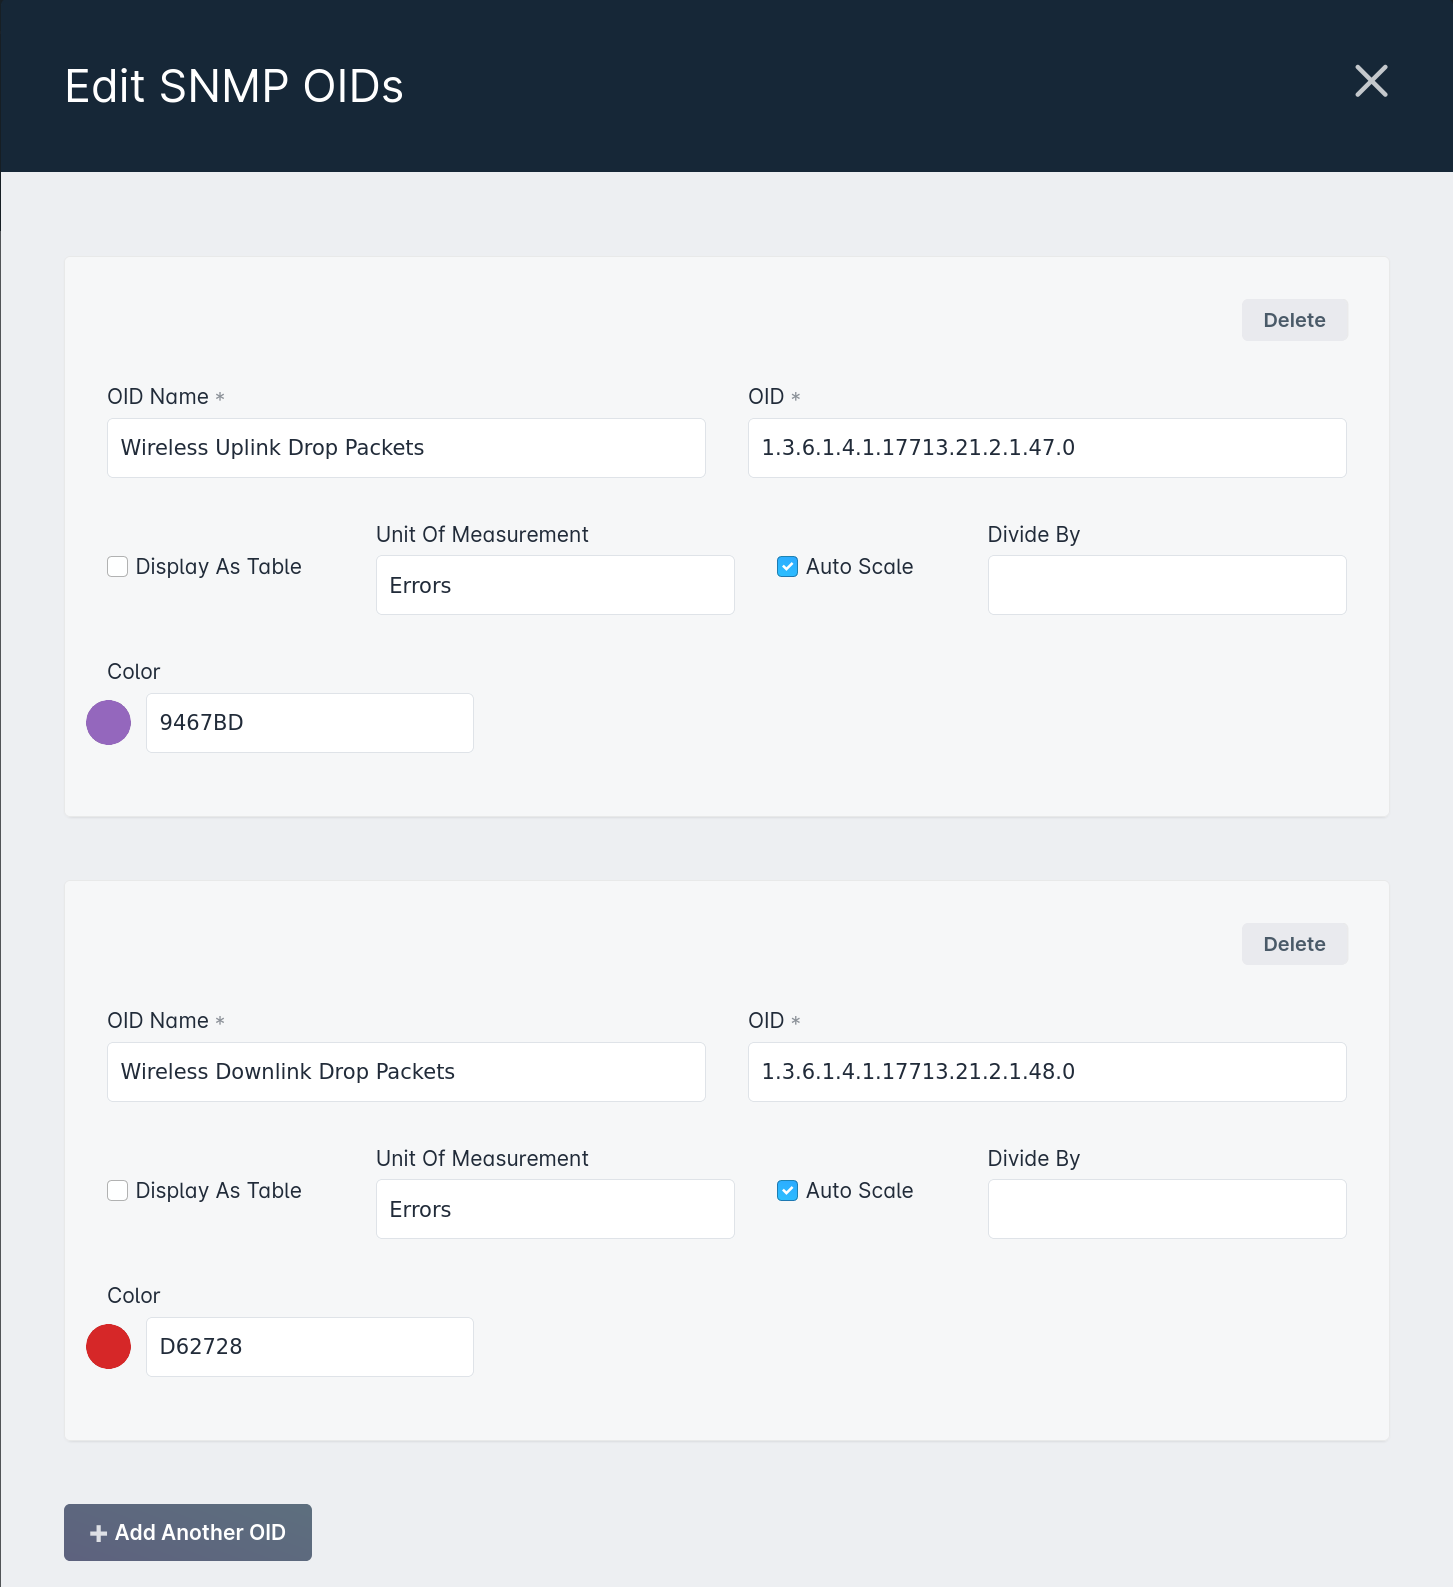
SNMP (Simple Network Management Protocol) has been around for a very long time, and the overwhelming majority of ISP level network devices support SNMP. From a monitoring perspective, SNMP is typically used to collect data from devices (SNMP polling) or to be alerted of events (via SNMP traps.) Sonar relies on SNMP polling to collect data about devices, and we allow Sonar users to define any type of polling they like. With SNMP polling, it’s up to the device manufacturer to expose different metrics, and some will give access to a very large array of data, whereas others will limit the information that can be collected.
Typically, a device will expose some standard parameters (for example, the throughput and error rate of physical interfaces, CPU usage, or uptime) and a variety of proprietary information that is relevant to the device in question. For example, a UPS may expose the remaining battery life, or whether or not it’s currently receiving power from the grid. Sonar allows users to both collect this data, and alert on it — to return to our UPS example, you may configure an alert to go out when the UPS is running on battery power, or when only 50% of the battery is remaining.
Fetching & Formatting
As mentioned earlier, the poller is split into three major components. Fetching and formatting data, work pools, and device mappers. Let’s start with fetching and formatting.
Since Sonar runs in the cloud, monitoring a customer network has challenges. We don’t want to monitor across the Internet, as any packet loss and latency between our services and your network would impact the results, and often, ISP devices are not Internet accessible. The Sonar Poller therefore deploys directly into an ISP network, and reaches out to Sonar in the cloud to fetch monitoring work to be performed.
The poller then evaluates the work provided to it by Sonar, and formats all the data so that the poller workers can execute it. Generally, data is moved around inside the poller in JSON or PHP object format, and all the communication between Sonar and the poller is purely JSON.
Powering the Poller
The poller itself runs inside an event loop powered by AmPHP. This event loop makes it easy for us to execute non-blocking, asynchronous work to fetch data from devices using ICMP, SNMP, or other methods.
PHP may be considered by some to be a bit of an unusual choice for this application, but it offers us a number of benefits. The main one is that the back end of Sonar is with PHP, so by creating our poller in PHP, all of the existing back end software engineers can easily work on it.
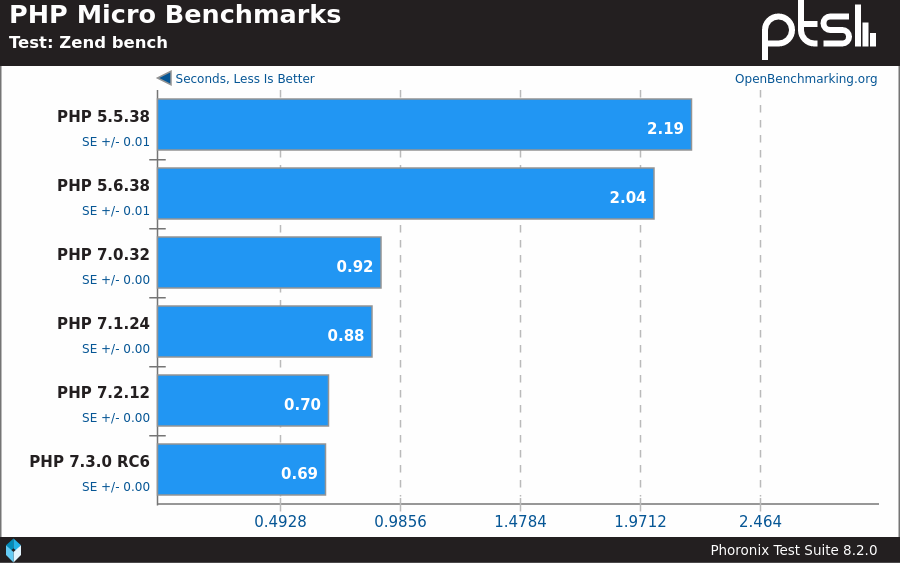
Modern PHP is also a fast programming language. PHP 7 was a giant leap in performance beyond PHP 5, and with PHP 8 and its JIT compiler on the horizon, we’ve got more performance ahead of us. Adding AmPHP on top of this gives us an extremely performant platform, without any developers having to learn a new programming language, and the speed of the most current Sonar poller is almost double the prior, non AmPHP based poller.
Work Pools
Once the monitoring to be performed has been fetched and converted into the proper format, tasks are deployed into separate ICMP monitoring and SNMP monitoring pools using the AmPHP Parallel extension. This allows us to scale the size of the pools automatically based on the number of CPU cores on the poller with true parallel processing. However, once you start performing high speed, parallel network monitoring, there are a lot of other issues that begin to crop up. For example, it’s possible to flood the network interface on the server the poller is running on and create false readings if you send too many packets at once.
There are also various configuration
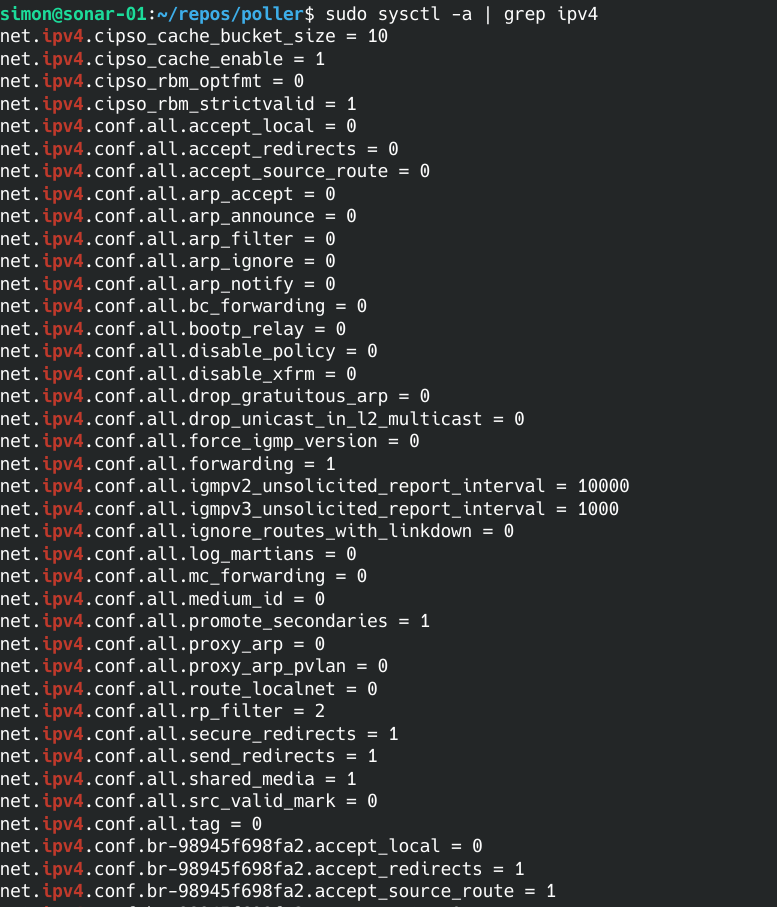
options in the Linux kernel that can have an impact on polling performance, mostly configured in sysctl. Options like icmp_msgs_per_sec or the number of open file descriptors can cause delays in polling when it’s being performed a high speed. To counteract this, the poller both automatically configures a number of kernel settings at install time, as well as staggering some requests out to minimize any erroneous readings as much as possible.
Device Mappers
The ICMP portion of the poller is fairly uninteresting. As mentioned, we use fping to collect this data and relay it back to Sonar. However, once we get to collecting non-ICMP device statistics, it gets a bit more detailed!
Inside Sonar, a user can configure a number of metrics that they want to measure, and Sonar will communicate this to the poller when it requests work.
However, the poller also collects a number of other metrics automatically to drive things like our parent/child mapping system, and Sonar Pulse. Our goal when collecting data is to make as few requests as possible, as the most time intensive part of network monitoring is requesting and receiving data back from the network. This means, for example, using things like SNMPBULKWALK when we can, or performing multiple SNMPGET requests at once, rather than running them sequentially.
When performing SNMP queries, the poller will also query a number of other parameters up front. One of the things we query is the SysObjectID. This is described in the appropriate RFC as follows:
The vendor’s authoritative identification of the network management subsystem contained in the entity.
This value is allocated within the SMI enterprises subtree (1.3.6.1.4.1) and provides an easy and unambiguous means for determining `what kind of box’ is being managed. For example, if vendor `Flintstones, Inc.’ was assigned the subtree 1.3.6.1.4.1.424242, it could assign the identifier 1.3.6.1.4.1.424242.1.1 to its `Fred Router’.
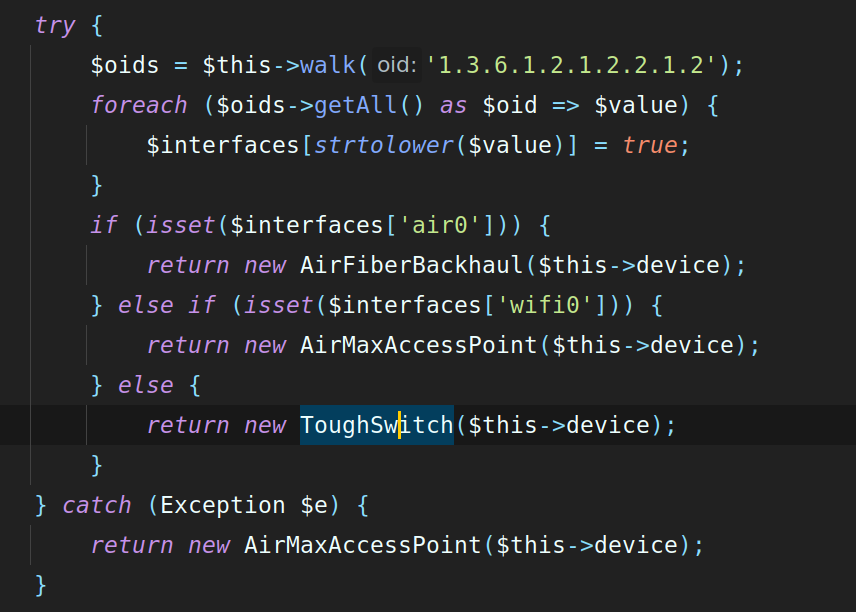
Unfortunately, one of the things you will quickly learn if you start playing with SNMP is not everyone follows the rules, or at least not the way you expect them to. For example, many Ubiquiti Networks devices return exactly the same SysObjectID result, regardless of whether the device is a Ubiquiti ToughSwitch or a Ubiquiti airFiber. Due to this, if you go and peruse the code for the poller, you will notice quite a few workarounds for this kind of situations — in the case of Ubiquiti as an example, we have to perform subsequent queries to find more data about a device and determine what type it is.
Once we’ve determined the type of device, we can then collect more specific data from it to aid in providing more detailed information within Sonar. This is done via what we call a Device Mapper, and we have device mappers built in for a variety of different vendors.
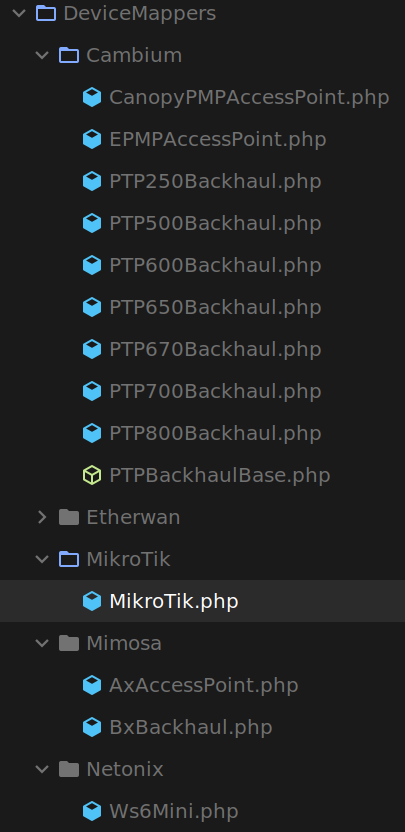
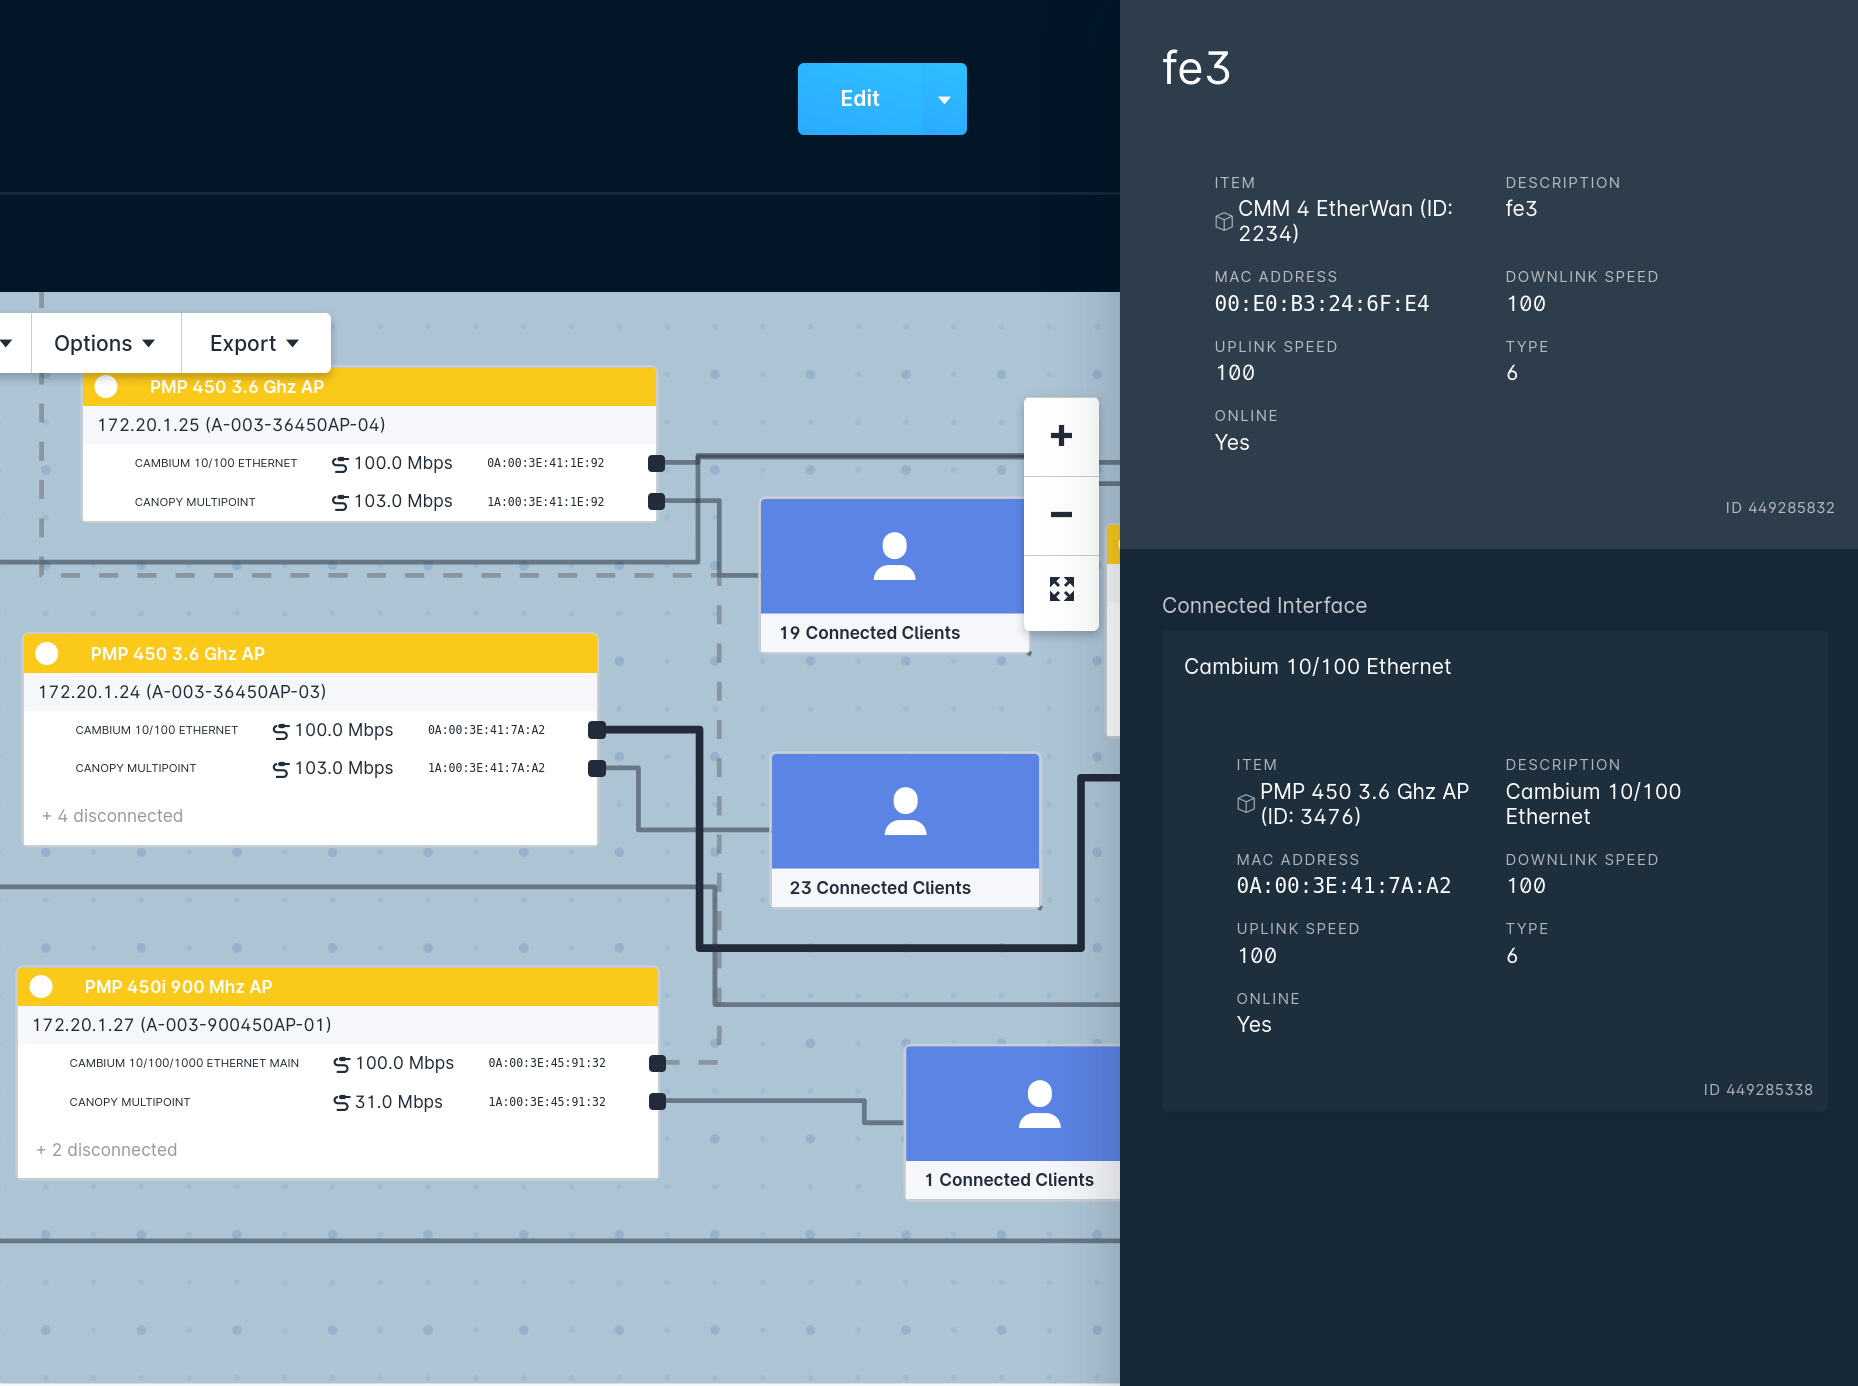
These device mappers will automatically fetch data from the device through a variety of means, typically to aid in building more comprehensive Pulse maps in Sonar (which we’ll touch on in a bit!) or to aid in showing which customers are connected to which aggregation devices. In the original Sonar poller, these device mappers would only work via SNMP, but in the latest release, we can use any mechanism available to us.
For example, a Ubiquiti ToughSwitch does not expose it’s MAC address table via SNMP, but we can fetch it by following a (slower) path of connecting via SSH, and deciphering it using the Linux command line.
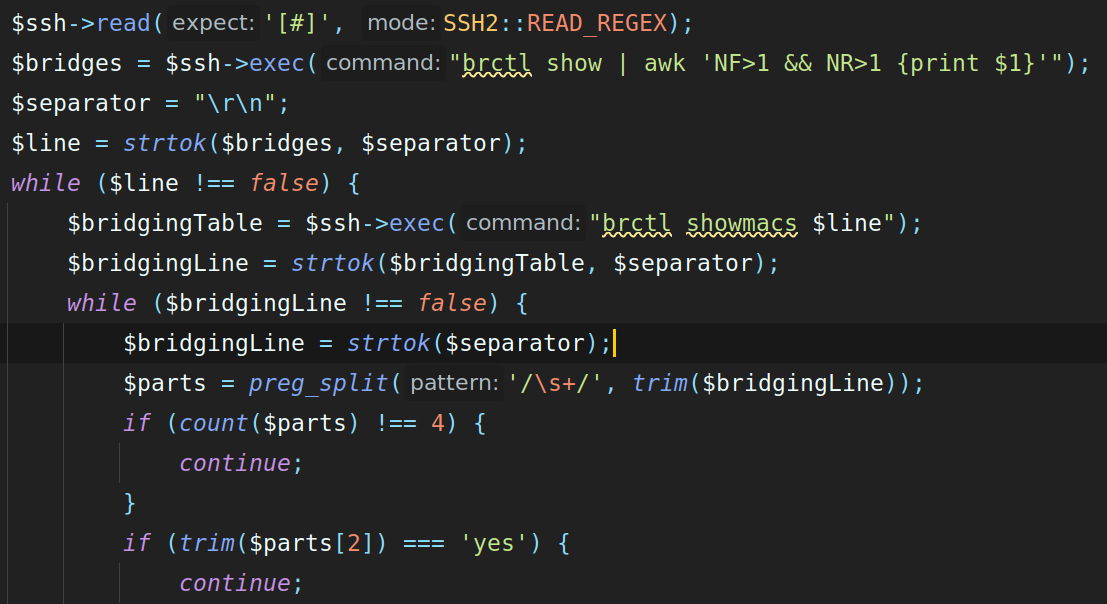
While this is not optimal, it’s better than nothing, and these custom device mappers that we are adding to the Sonar poller mean that we can work around these kinds of obstacles to bring more value to the maps, charts, and graphs inside Sonar.
Once these device mappers have finished their work, the data is encoded back into a standard format, and delivered back to the main poller process, so that it can all be bundled up and sent back to Sonar. The poller needs to be able to complete all this work as quickly as possible so that polling cycles can be run frequently, so the vast majority of the work and improvement done on the poller goes towards bringing this time down.
Back into Sonar
Once Sonar receives the data from the poller, it has to process it before displaying it. The basic metrics that are being collected via SNMP and ICMP are written into TimescaleDB to be presented in the user interface.
The additional data that is collected is used to power Sonar Pulse, and the parent/child mappings shown in the interface automatically.
Pulse & Parent/Child
Sonar Pulse and the parent/child mappings are two things that bring a lot of benefit to our users, but are very complicated to implement and maintain. Generally speaking, there are rarely ways of calculating the parent/child relationships using standard SNMP queries, so we have to build device mappers for every aggregation device we want to support. For example, a Cambium PMP access point and a Cisco CMTS will both expose their connected users via SNMP, but in drastically different ways.
Pulse is even trickier. If you haven’t seen Pulse in action, it’s a tool within Sonar that attempts to automatically calculate the layout of your network.
Performing this calculation is extremely challenging. There is generally no way of getting this information via SNMP directly — we have to infer this information by looking at different attributes of the devices.
Just a few of the things we collect to try to determine this are the MAC address table on switches, the ARP table on layer 3 devices, all the MAC addresses of every interface on a device, the type of interface, the status, and any proprietary data that the device manufacturer makes available. We then have to sift through all that data, and try to determine an accurate network layout from the information made available to us.
Getting Pulse to 100% accuracy is an ongoing project that may never be over, but when mapping devices that expose this kind of data via SNMP, we can generally do a very good job, and having an automatically updated, accurate map of each network site and the overall layout inside Sonar is a target we keep working on hitting!
More Layers = More Benefit
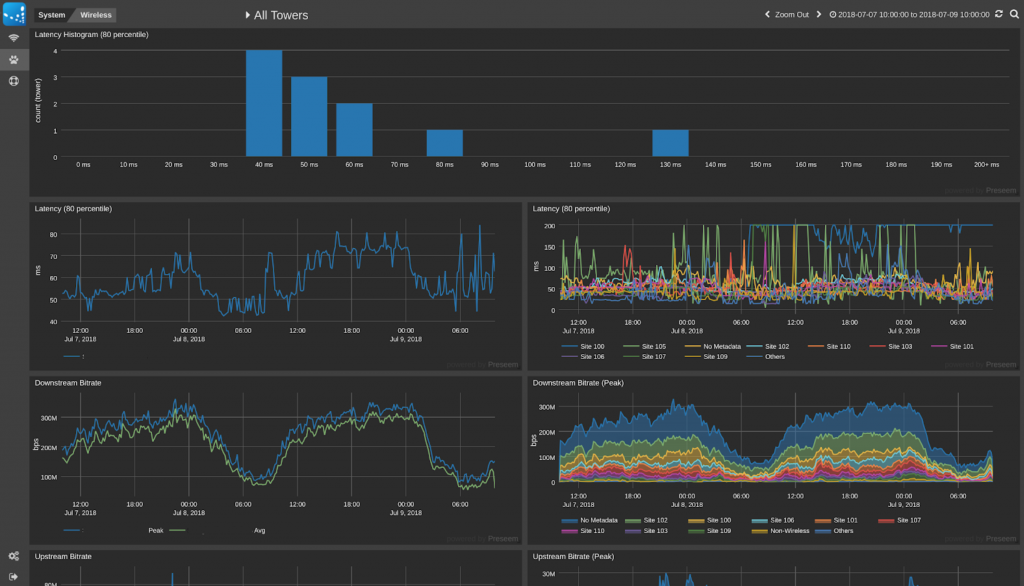
One of the great things about all this work we do to collect and map this data is that we make it all available via our API, and that’s meant many of our partners have taken advantage of this to improve their products and, in turn, make Sonar even more useful for our mutual customers. As an example, Preseem uses the Sonar API heavily to collect customer information, IP address, and other relationship data to improve their UI, as well as to inject useful data back into Sonar that they collect.
Also, by making our poller open source, we empower both our partners and the community to submit their own device mappers if they want to — you don’t have to wait for us to add some obscure piece of equipment that is kicking around in your network! In the next article in this series, I’ll walk you through how to develop and test your own device mapper, and then submit it to us for inclusion in the poller.