Have you ever read the release notes for a new piece of software or app? It’s very common that, amongst the specific changes and improvements, that there will be a line saying something like various performance improvements. It’s sometimes tempting to think this is just fluff added to fill out the line count of upgrades, but it can often be hard to really talk about performance improvements to a piece of software without getting into tons of technical detail. For this blog post, I’ve decided to do exactly that, so you can see a bit of what goes into a simple line like performance improvements for customers of Sonar.
Measuring Performance
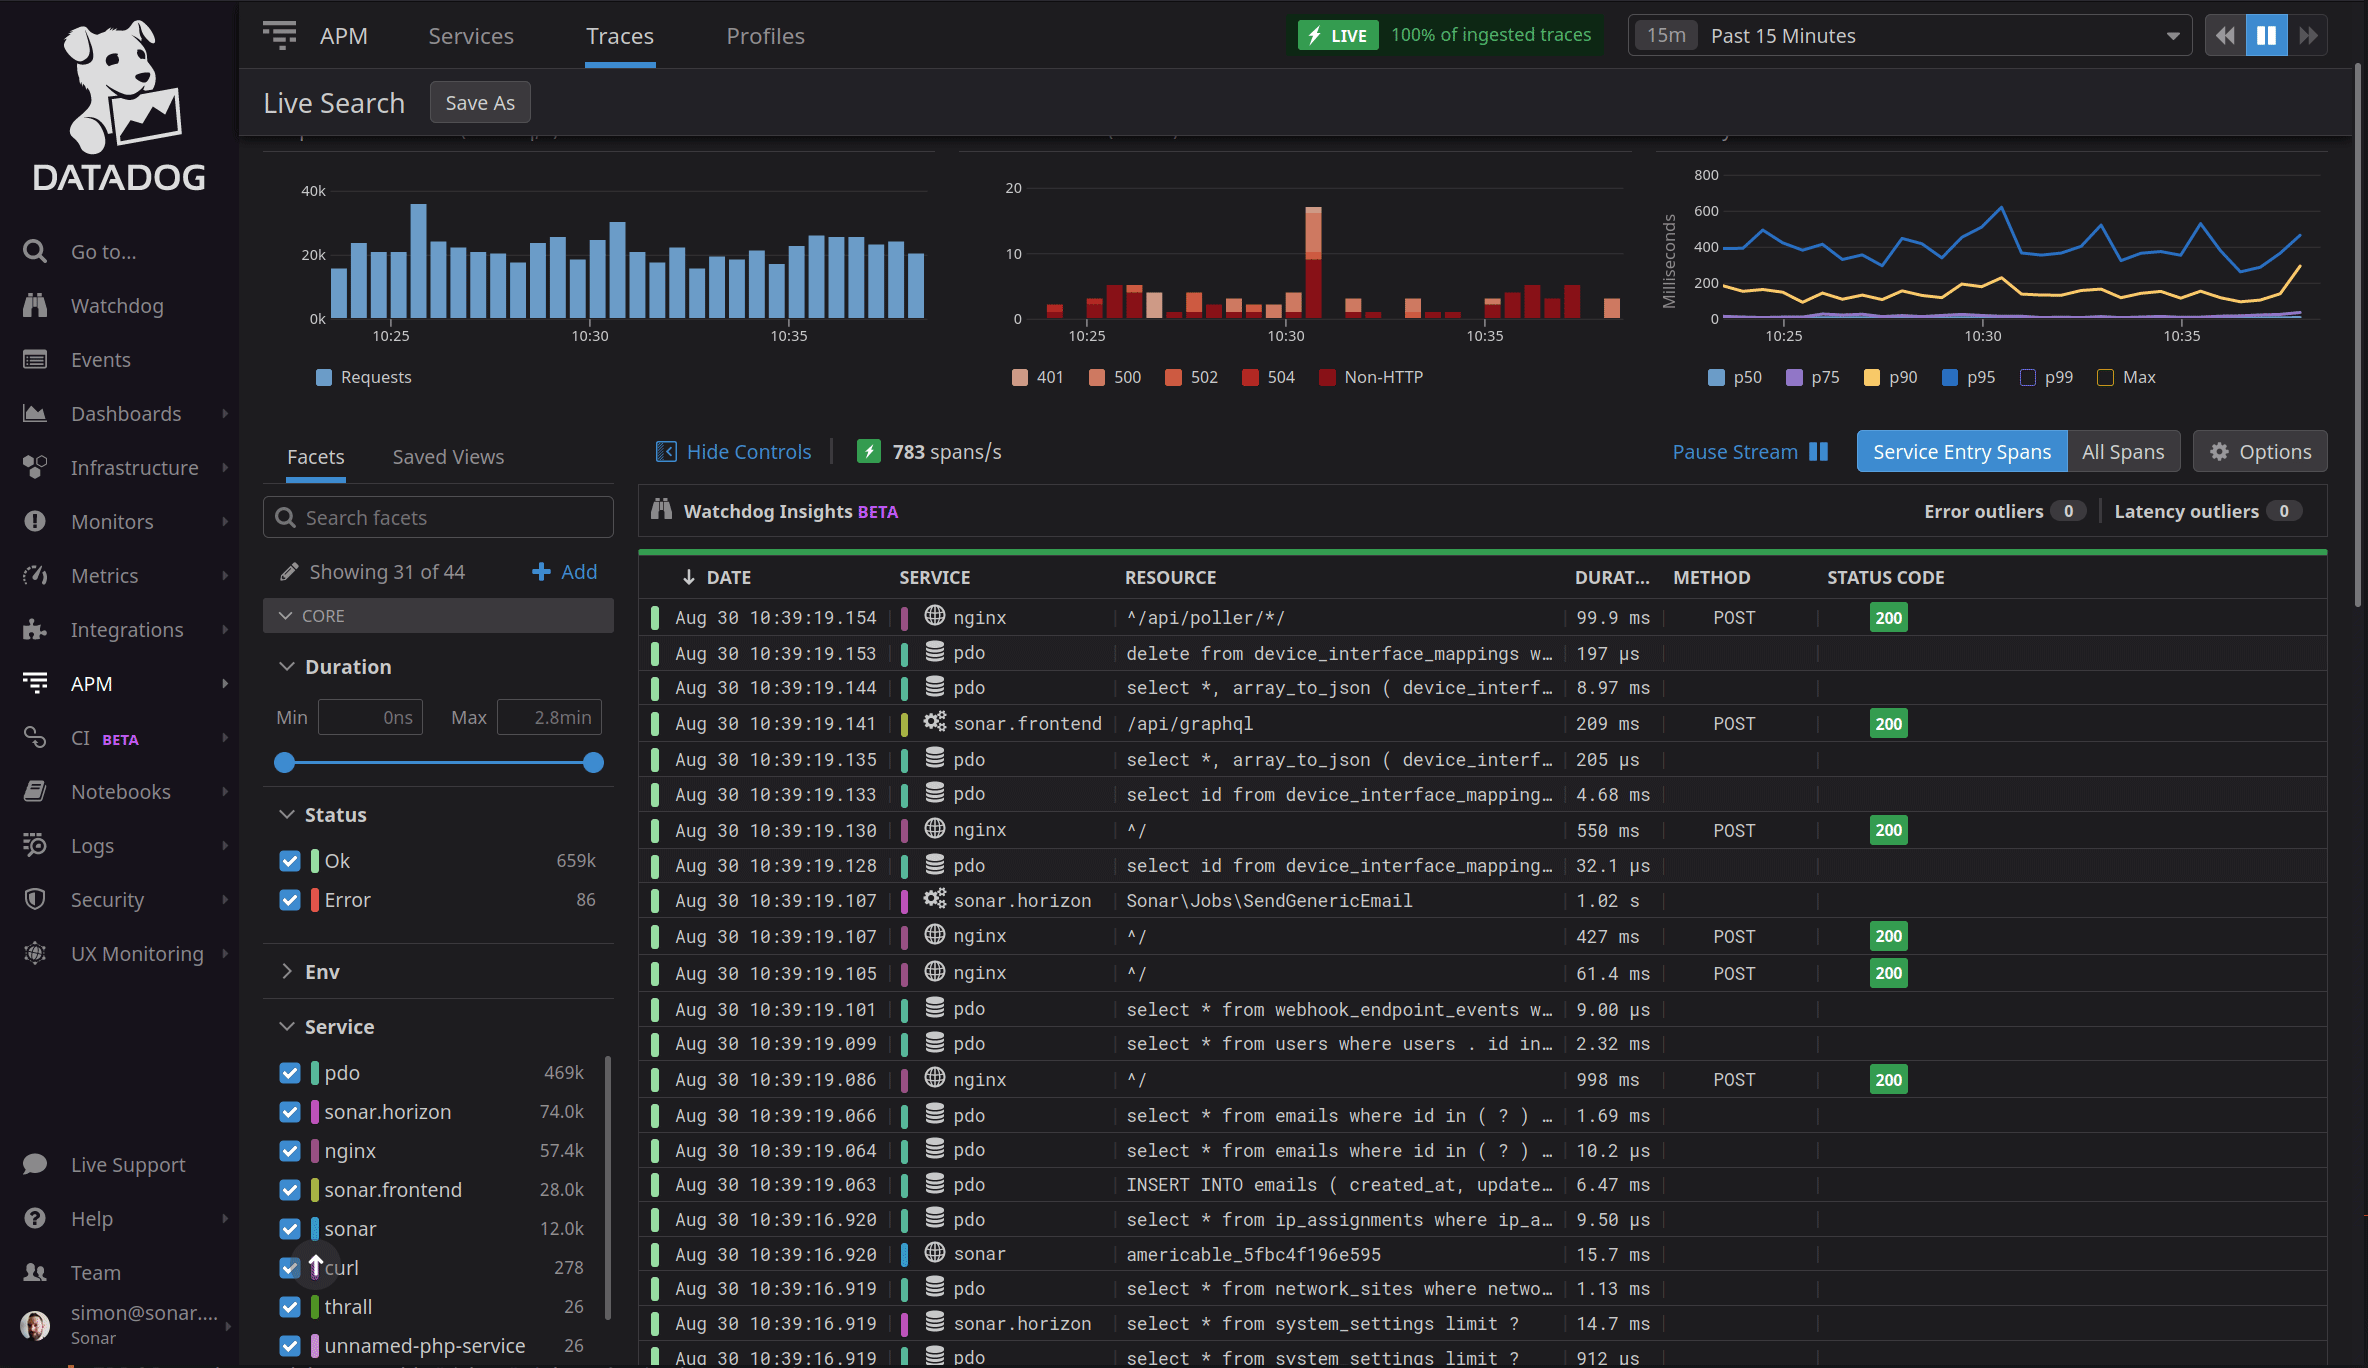
In order to improve performance, we first have to measure it. I’ve talked about this before on this blog, but one of our best tools for measurement today is the DataDog Application Performance Monitor. This lets us view, in real time, the performance of the application on a request by request basis.
Just getting this working was a challenge for us. We run our infrastructure using Swoole, an asynchronous PHP extension that allows us to run PHP in a non-typical way, although it is slowly starting to become more common.
Sonar’s Async Environment
A usual PHP application runs through a simple cycle when a request is made – the entire application is booted up, the request is handled, and the application shuts down. This allows each request to be handled in a vacuum – no other requests can affect the current one being handled. It also helps handle things like memory leaks, as there isn’t much time for them to be a concern.
However, async environments like Swoole work differently. The application is booted up, and kept in a booted state. Each request is handled within the same context. This means you lose the performance hit of having to boot up and shut down on every request, and you can also utilize asynchronous programming using coroutines. However, it also brings numerous challenges – for example, if you add data to an array during a request and store it somewhere permanent (like in a private variable on an object), then the stored data will still be there on the next request. This can mean significant issues with memory usage (as well as leaking data between requests) if not carefully handled by developers.
However, the benefits are huge, if an environment like Swoole is treated correctly. Our GraphQL API is huge – we have hundreds of types, queries, and mutations, along with a variety of custom scalars, enums, and more. While this API is extremely powerful, it’s also very costly to run from a performance perspective – just parsing the schema and booting up everything we need to handle a request takes about 300 milliseconds. While that may not sound like a lot, in reality it is a huge number – every single request to our infrastructure would take an additional 300 milliseconds, and the computational cost is also high to parse and setup the schema over and over again. We’d need more CPU cores, more memory, and virtual machines, and scaling this would be painful. Since Swoole boots once and then responds to requests without shutting down, it means we can just pay that cost once, and then pass the savings on to you – now your request to our API (or each time the application makes a request on your behalf) is reduced by 300 milliseconds or more. When we started using Swoole, it was pretty uncommon in production applications, but it’s starting to become more commonplace – Laravel (one of the largest and most popular PHP frameworks out there today) recently added Octane, a package that makes it work with Swoole and RoadRunner (another async PHP server written in Golang.) Unfortunately, we’d already done all the work to make Laravel work with Swoole ourselves, but at least it saves time for others in the future!
Finding More Ways To Improve
Using Swoole brought other challenges though. The DataDog APM that I mentioned previously was built to work using a standard PHP stack, and it didn’t understand Swoole’s persistence. Thankfully, a lot of hard work by some very talented developers on the Sonar team meant we were able to deploy some custom solutions which allowed us to get APM working.
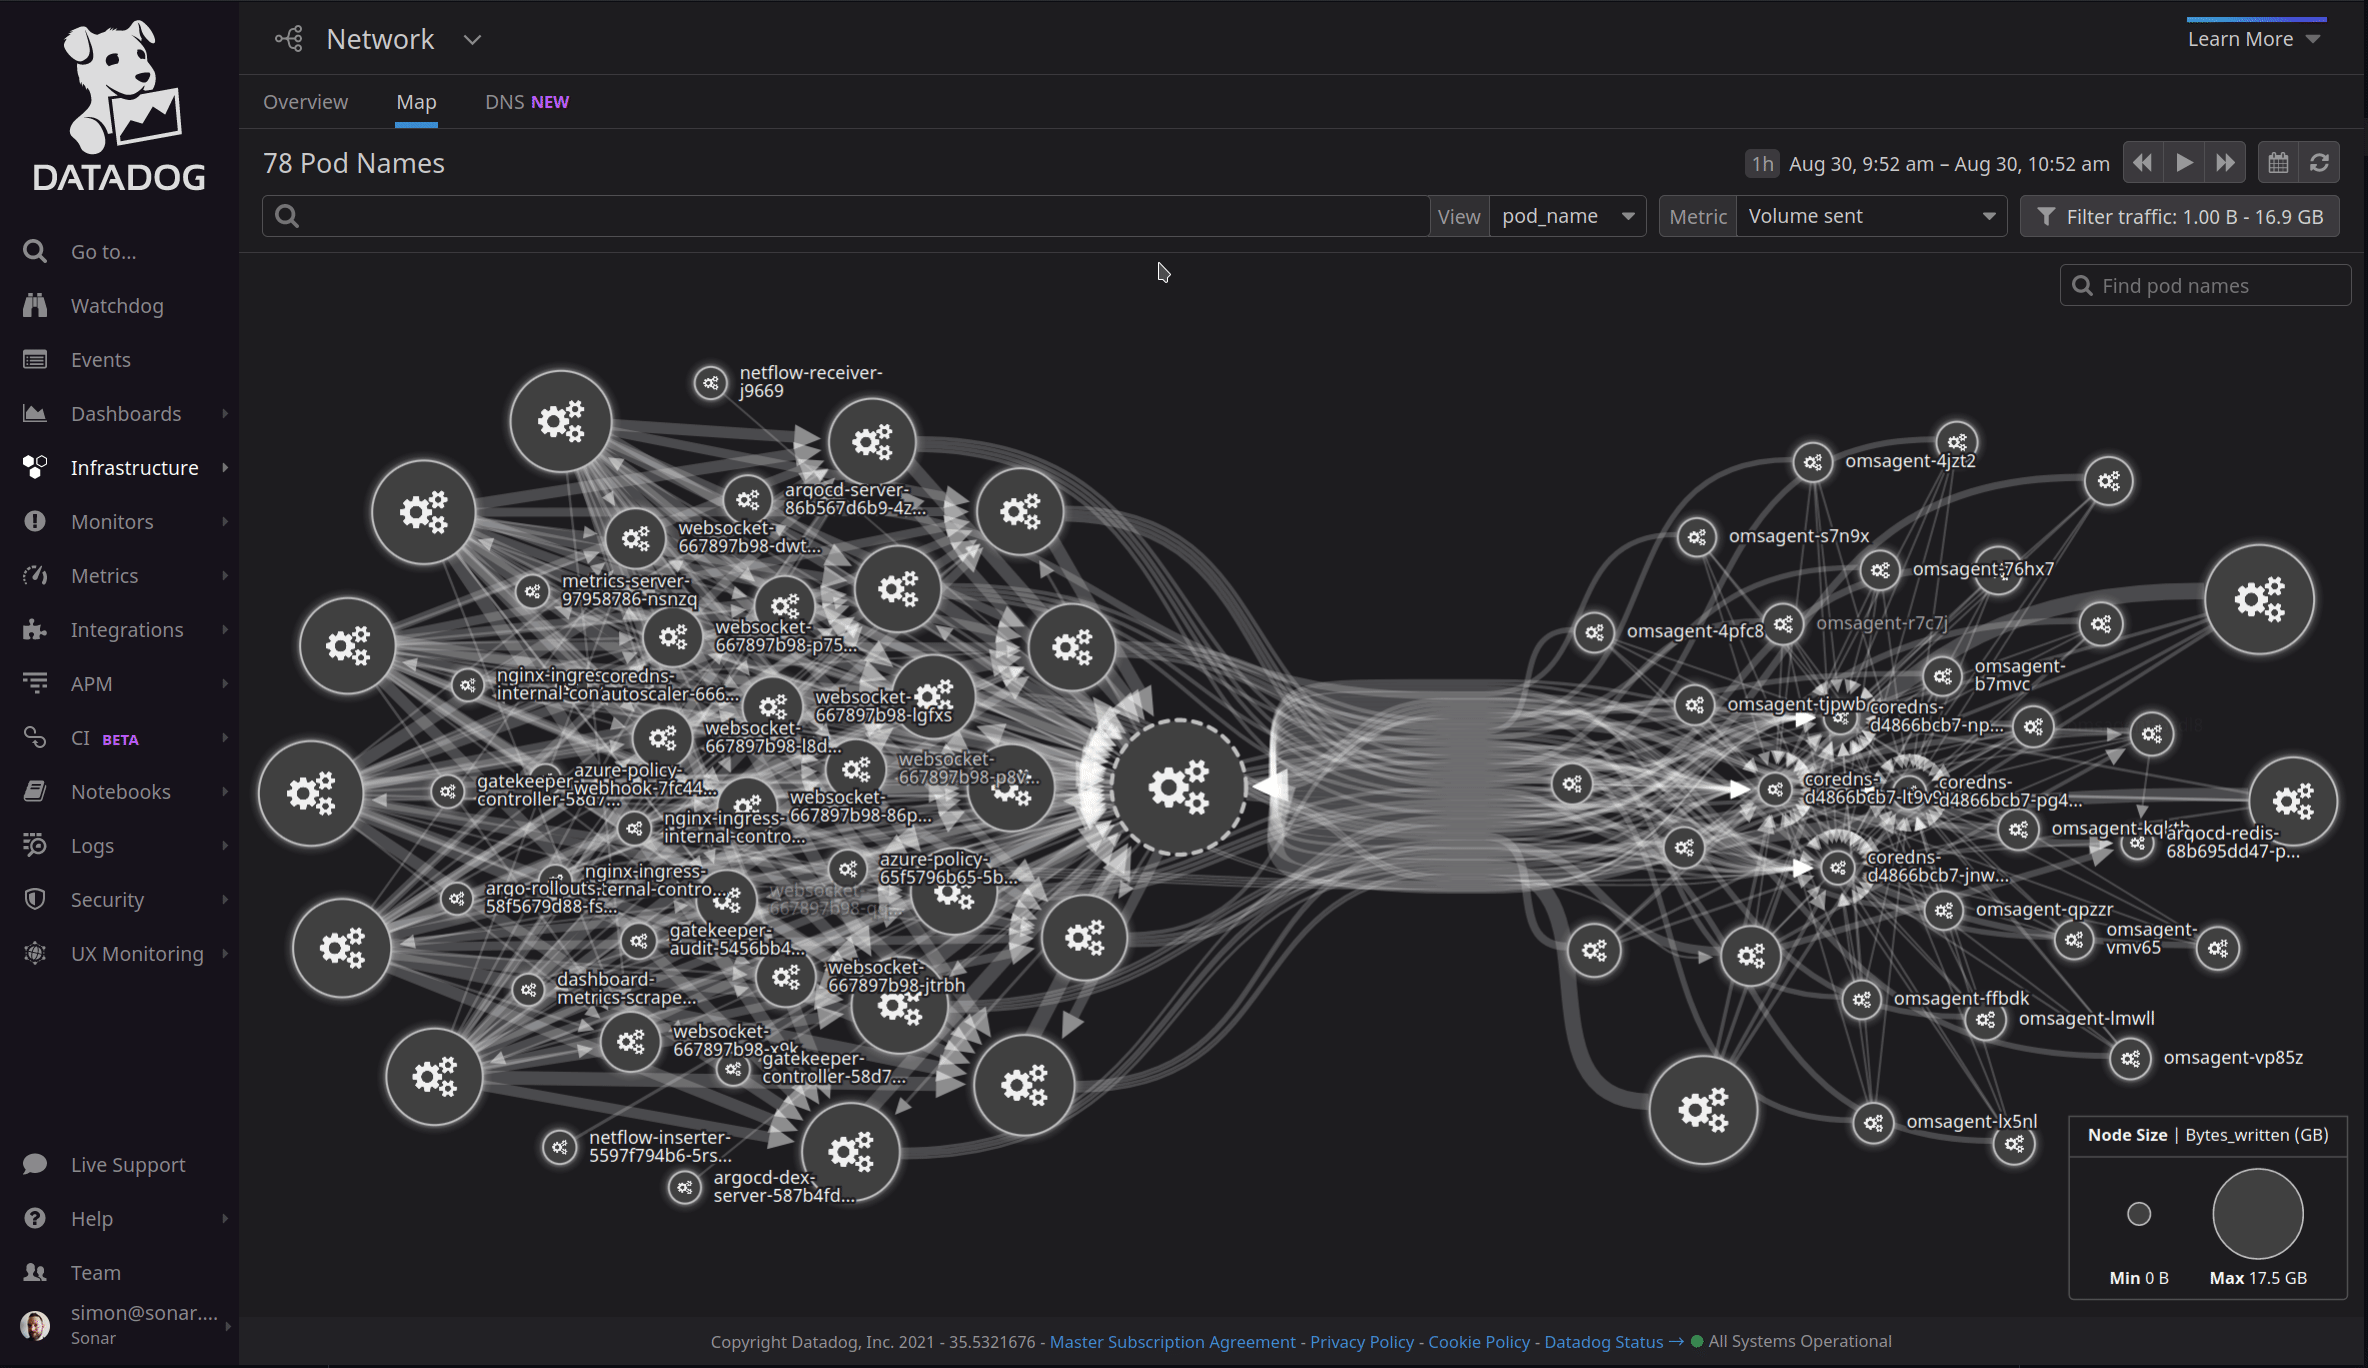
You may think that it shouldn’t be that hard to track down performance bottlenecks without a solution like APM. The network map above shows just a portion of our infrastructure and how services are interconnected – tracing through all this manually would be extremely challenging. It also helps us take a look back in time – often, by the time we hear from a customer that something was slow or didn’t work the way they expected, the problem has disappeared and this typically leaves the developer having to respond that they couldn’t reproduce the error. Since APM is historical as well as real time, we can dig up a specific request made by an individual customer and see exactly what happened. This is the reality of performance improvement in a modern application – it’s very rare that an issue is persistent and long lived. It’s often a combination of factors that interact to create temporary issues that recur randomly, leaving them tough to track down. While there’s been hundreds of inefficiencies we’ve tracked down and improved over time, this post will now become the story of one of them.
Speeding up ElasticSearch
Our API is powered by ElasticSearch and I’ve talked about this in some detail before. Using ElasticSearch to power our API means it can do some of the amazing things it can, like providing full text search capabilities directly in the API. It has brought numerous challenges however, and this section is the story of hunting down and resolving just one of them that became nothing but performance improvements to the API in our release notes.
While our API has many fantastic features, some of the most useful ones are just core requirements of GraphQL. One of these is being able to request related data in a single request.
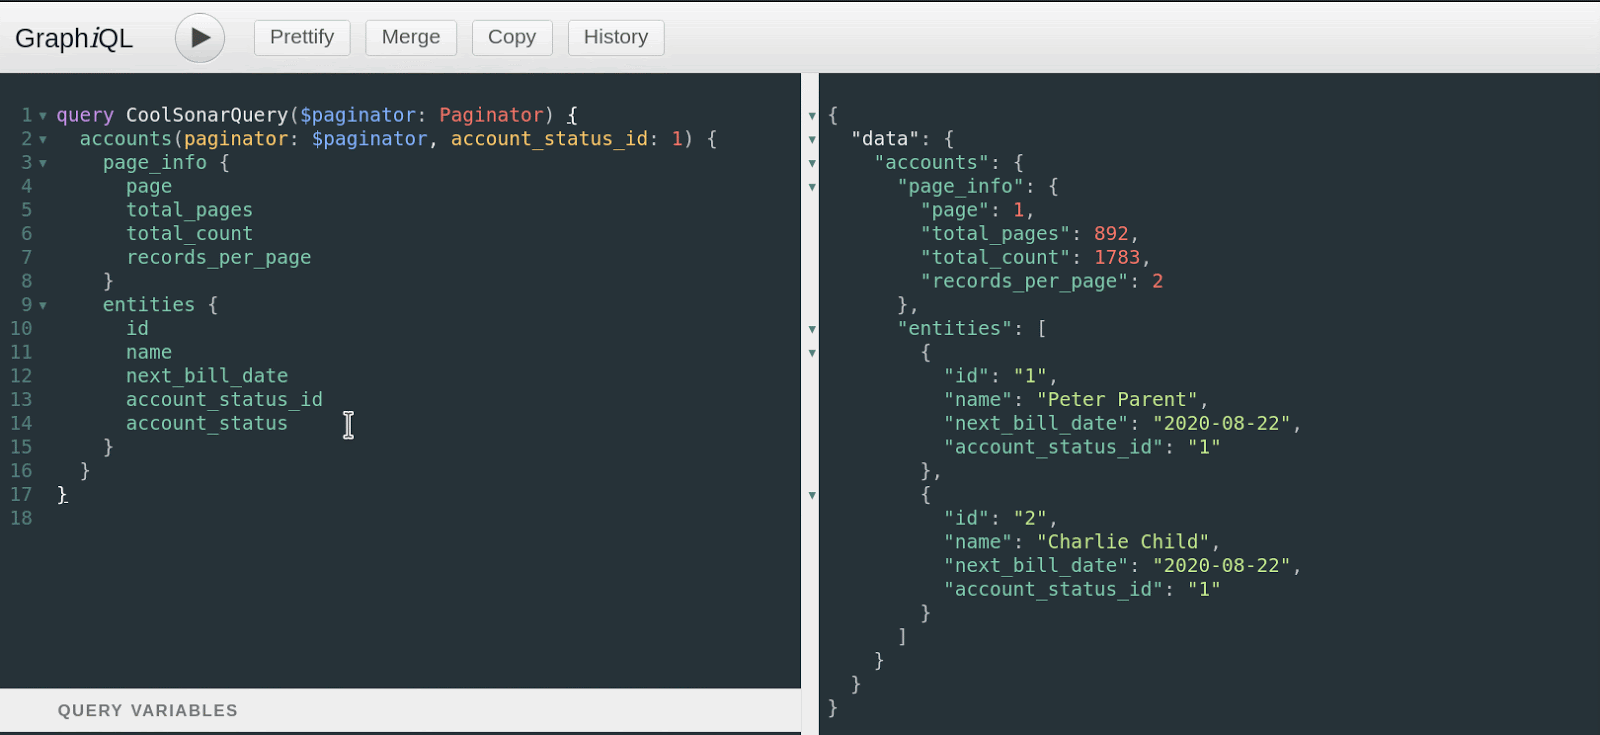
For example, let’s say you wanted to get all accounts in Sonar that are active, along with all of their due invoices, the email addresses of all the contacts associated with those accounts, and their automatic payment method, if they have one. In a traditional REST or SOAP API, this would probably mean first making a request for all accounts, getting all their IDs, then requesting all their invoices based on those IDs, iterating all of those, finding the due ones, sorting them, etc. With the Sonar GraphQL API, you can just make a single request, with all the filtering desired, and get back a single response with all the data you need. However, making this work was not trivial.
ElasticSearch does not support the concept of joins, like a SQL database. This means you cannot fetch all accounts and then connect the invoices table to fetch all due invoices related to those accounts. You have to make individual requests to ElasticSearch for each index and deal with the data that way. An index in ElasticSearch is equivalent to a table in a SQL database – in Sonar, accounts live in one index, invoices live in another, contacts in yet another.
Another wrench in the works is due to the way GraphQL works. Each level affects the next, and so you have to parse each level individually. To explain this better, think back to my example in the first paragraph. If we want to get all accounts that are active and for those accounts, fetch all of their due invoices, we first need to know which accounts are active. Therefore, we can’t fetch all of their due invoices until we’ve first fetched all the accounts, as we don’t know which invoices are related to active accounts until that’s happened. What this means for our application is that each level of the request has to be parsed independently. If we break this specific example down into steps, there are two. The first step is to fetch all accounts that are active. After that, we can fetch all due invoices, email addresses of the contacts associated with those accounts and their automatic payment method based on the IDs of those accounts. So, in this case, we only have two steps, but we support up to a depth of 11.
GraphQL also allows multiple entities to be queried at each level, so these requests can be very complex. For example, the first level could query all accounts that are active, but separately query all accounts that are inactive, or even all tickets that are pending a reply. Then, the next level could have all due invoices related to the inactive accounts, and all potential recipients associated with the tickets that are pending a reply. These relationships can keep fanning out farther and farther, all the way to a depth of 11 relations.
Fetching Data
In our first design for the API, each entity was handled individually as an ElasticSearch request. Since ElasticSearch doesn’t allow joins, we have to make a separate request for each dataset anyway, and this approach worked fairly well in the beginning.
What this meant in practice is, to use our original example again, our ElasticSearch queries would look something like this.
- Fetch all accounts that are active. This meant first querying all the account statuses to see which ones are active, and then using those account status IDs to filter down all the accounts.
- Now we have all the accounts, we can build up the response to the query for that portion of the request. Next, we can take all those account IDs and query for all invoices that are due, related to those accounts, by filtering using those account IDs.
- To fetch all the email addresses of the contacts associated with the accounts, we’d do the same thing on the contacts index. We can request the email_address property of a contact, filtering the results by the account IDs we have, and then building up the response.
- For additional levels, we’d have to take these results, and do the same thing again one level deeper. For example, if the request had also contained all debits on the due invoices, we’d take the invoice IDs, use that to filter down the debits index, and then build up that response.
While ElasticSearch is built to handle multiple queries like this at a time, we noticed in our application monitoring that some requests were taking a very long time to process. After some digging, we realized why. In order to make our API performant (and to more easily handle all the complexity of GraphQL) each group of entities in a request was being handled separately and independently. For example, our first request for all accounts that are active was handled in its own process. Then, the due invoices for those accounts was handled by passing the account IDs up into the next level. Fetching the email addresses of the contacts associated with the accounts was handled in another process, which accepted the account IDs and ran the query. However, each level of the request had to be fully handled before the next one was triggered, so a very deep query with lots of data requested on each level had a lot of places to slow down, and some of those places affected us in this scenario.
The Anatomy of an ElasticSearch Request
ElasticSearch handles requests in different ways, depending on the types of nodes you are running. In a simple implementation, an ElasticSearch node performs all functions for the cluster. It is simultaneously a master, a data node, an ingest node, a transform node, and every other node type ElasticSearch supports. In a production environment, these responsibilities are usually split. The master nodes govern and maintain the cluster. The data nodes hold data, split into shards. A shard is essentially a subset of the overall index. For example, let’s say our accounts index holds data for every account of each one of our customers. This index can quickly become very large – perhaps even bigger than the available disk on one of our ElasticSearch nodes. By splitting the index into shards, that data can be spread across multiple data nodes, and this process is transparent to the consumer – ElasticSearch handles stitching the data back together in response to a request by itself. It also means queries can be run in parallel more easily, as multiple nodes can be processing requests on their assigned shards at the same time.
However, letting ElasticSearch handle this itself can come at a cost. By default, ElasticSearch will distribute documents across the various shards that make up an index by itself. As your cluster grows, this can result in very inefficient queries. Let’s say you are a Sonar customer, and you have 100,000 accounts in your Sonar instance. Let’s also say for the sake of this example, that we have 10 data nodes, and each data node holds one or more shards for the accounts index. Because we are also storing data for many other customers on these same nodes, there is no guarantee on the distribution of your data across these 10 data nodes. Perhaps 99,999 of your customers are on one shard, and the last one is on another. What this means is that, for every single request made for your customer accounts, we have to ask ElasticSearch for that account data, and ElasticSearch has to communicate within the cluster and say to each data node “Hey, I need the results for this accounts request. Which one of you data nodes has information in the accounts shard that’s relevant?” In this example, only 2 out of the 10 nodes hold useful data, but every node has to check just to respond with “Not me!” This takes up processing cycles. It’s also affected by latency. For resiliency, we distribute our ElasticSearch nodes across multiple data centers, which introduces latency between them. Even if this is just a few milliseconds, that means for each request, we would have to eat that cost while we wait for each data node to respond before knowing the final result. This also means any temporary latency or degradation that exists between data centers is now affecting every request, and if one data node becomes overloaded and starts responding more slowly, it affects every request, even if that data node has no useful data to respond with.
However, we had already taken this into account when we originally built our API, and we implemented custom routing for our customer’s data. This meant that we can tell ElasticSearch “Hey! Search for the data on this shard! It’s all there, I promise!” and save hitting all the other data nodes when fetching data. However, this was just the start of making these requests more efficient.
Thread Pools
No application can handle an infinite number of requests at the same time. Scaling is normally handled in a number of ways – one is by just throwing more processing power at an application, the other is by somehow batching or holding onto requests until they can be processed.
ElasticSearch uses thread pools to hold onto pending requests until they can be processed. Ideally, you want these pools to be empty the majority of the time, as a request sitting in a pool means it is not yet being processed, and so the response is delayed.
After scaling up our infrastructure, we started to notice some queries were slower than we expected, and some of that was to do with these thread pools. Jumping back to my previous explanation of how our GraphQL API handled each level of the request, we noticed a couple of things thanks to reviewing our APM metrics. The first was that slow requests would often correspond to an increase in the search thread pool count – this meant requests were being held before processing. The second was that a fairly large portion of the request time was being taken up by latency between our web servers and ElasticSearch itself.
If you think back to our GraphQL processing, it happens in layers. First, we have to get all the data for the first level of the request (for example, all accounts that are active.) Next, we fetch the data for the next level (for example, all invoices that are due for those accounts and all email addresses of contacts associated with those accounts.) These examples are pretty trivial – many common requests to our API will request hundreds of separate datapoints at multiple levels.
Since each level has to be processed before the next one can be evaluated, what was happening was that each dataset was being individually requested (e.g. all invoices that are due was one request, and all email addresses of contacts associated was another request.) This meant two trips across the wire to ElasticSearch. Even though these could happen in parallel, building up a TCP request and handling it has a cost, and the more of these that happened at once, the more costly it was, both for our application and for ElasticSearch. Next, since all these searches would hit ElasticSearch at the same time, this would often result in searches going into the search thread pool under load. Now we had a delay introduced by the thread pool waiting to process the request, as well as the cost of the TCP roundtrip. Our application then had to process all these responses in separate processes and pass them up the chain to the next level of the request.
This problem compounded more and more the bigger our user base got, and the more complex their API requests got. We’d often see 25% or more of request time simply being TCP roundtrip time and response delays due to the thread pool growing.
What We Did
Looking at this problem, there’s two ways to reduce it. One is to cut down the TCP requests, and the other is to cut down the number of queries. Thankfully, there’s a way to do both with ElasticSearch, and that’s by using the multi search API. This endpoint allows multiple searches to be combined into a single request, which is then responded to as an individual response. This means a single TCP roundtrip, and a single search request. However, utilizing this API was a tricky undertaking. Since all of the GraphQL processing in our application happens asynchronously, each resolution is resolving in a vacuum – it doesn’t know about all the other data being resolved on the same level. The resolver for all due invoices has no idea that there is also a resolver for the email addresses of all contacts. We didn’t want to group them into a single process, as that would eliminate the benefit of them being able to operate in parallel. We also didn’t want to remove the parallel operation as there is still a lot more work to do after the data is fetched – it still has to be processed, shaped into the GraphQL response, and more.
What we needed was some way to connect these requests together without removing their ability to process as much of the data as possible in parallel. In order to do this, we built a service inside Sonar called the FutureSelfPaginatingResultsContainer. While the name is a bit of a mouthful, it works like this.
The FutureSelfPaginatingResultsContainer runs permanently in our Swoole environment. Each request that comes in is assigned a unique identifier, so that both the container and the request knows which dataset is related to which request. As each level of a request is being processed, the subset of the level (for example, all due invoices) tells the FutureSelfPaginatingResultsContainer something like this: “Hey, I’m part of request ABC123 and I need the results of the query all due invoices for these account IDs.” Next, the subset of the level that needs the email addresses of all contacts tells the FutureSelfPaginatingResultsContainer something like “Hey, I’m part of request ABC123 and I need the results of the query email addresses of all contacts for these account IDs.” The container knows how many individual subsets there are, as it’s been able to see the entire scope of the query when it came in. This means it knows when each subset has asked for a response. At that point, it batches up all the requests and sends them as a single multi-search request to ElasticSearch. While this is happening, those individual subsets can pester the container for the results, and it can either tell them to keep waiting, or supply them to it. Since the container is running in the same processes as the requesters, there is no TCP roundtrip here, and very little computational resources needed.
Once the results have been returned, the container can then deliver the results to the requesters and then discard them. This process turned the multiple TCP roundtrips into one, and the multiple search requests into one.
This was not a trivial process. The tough thing when building things at this kind of scale is that the documentation only tells part of the story. Yes, multi-search requests are more efficient, but do they create any other kind of issue at load? How do we test this container process? How do we monitor it? Is there another way to approach this problem? These questions only get answered by significant research, testing, and evaluation of results. It took a lot of work and failed experiments to settle on this approach, and this is just one of the many improvements we’ve made to Sonar by constantly monitoring, watching data, and looking for solutions.
If you’ve made it to the end of this blog post, you may now understand how and why this 3,731 word post gets distilled down into a simple phrase in a change log:
Various performance improvements to the API
Until next time, thanks for reading!